


tags: Intel, Profile, MPI
#
What is ITAC
ITAC (included in OneAPI) is a MPI tracer and analyer for intelmpi, if your program can be compiled with Intel MPI, then you can get a detailed MPI trace data by ITAC.

How to use ITAC
setup for tracing
module use /scinet/intel/oneapi/2021u4/itac/latest/modulefiles
module load itac

export LD_PRELOAD=/scinet/intel/oneapi/2021u4/itac/latest/slib/libVT.so
config tracer
by Env
export VT_LOGFILE_FORMAT=stfsingle
export VT_PCTRACE=5
export VT_LOGFILE_NAME=...
by Config File
export VT_CONFIG=/home/l/lcl_uotiscscc/lcl_uotiscsccs1034/icon/hand/icon-intelmpi/build/experiments/exp_scc2850/scripts/itac.conf
Config Options
Just list some useful:
# This line will be ignored as a comment
CURRENT-DIR "/home/l/lcl_uotiscscc/lcl_uotiscsccs1034/icon/hand/icon-intelmpi/build/experiments/exp_scc2850/scripts"
# The Intel Trace Collector uses the current working directory of the process that reads the configuration on all processes to resolve relative path names. You can override the current working directory with this option.


PCTRACE 5

# trace level normally use 5

PCTRACE-FAST on

# trace without check fails

MEM-MAXBLOCKS 16

# trace max block on memory

PROCESS 0:N OFF
# turn off trace for all core
PROCESS 1:N:10 on
# turn on trace for core #1,11,..10n+1 tile N

# by turning off trace for some cores can reduce the Memory usage and accelerate the trace speed.


TIME-WINDOWS 0:1, 420:720

# open trace for some time: from sec 0 to sec 1 and sec 420 to sec 720.
for more options you can find in Intel® Trace Collector User and Reference Guide
issues
oom
turn down the MEM-MAXBLOCKS and use less process to trace.
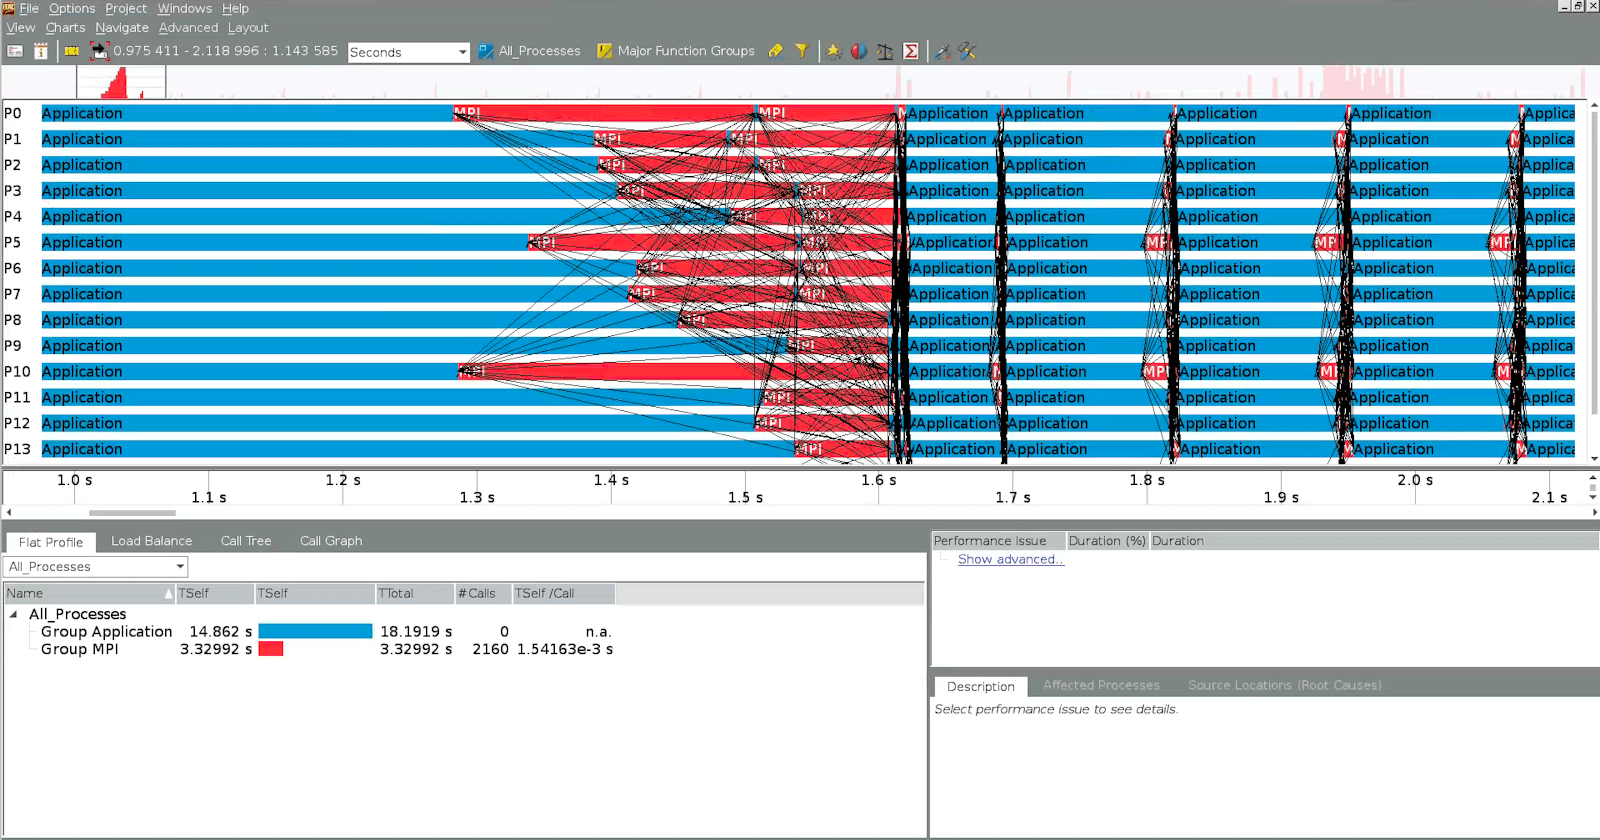
visualize ITAC result
traceanalyzer /path/to/collection/database/foo.stf